
Stats for Ontario, Canada
|
COVID-19 &
Respiratory Virus - Weekly Stats for Ontario, Canada |
This page contains data from official Ontario, Canada COVID-19 data sources including Public Health Ontario and Health Canada, updated weekly to show current COVID variants circulating in the province, COVID wastewater levels, hospitalization and case rates for COVID, Influenza or RSV and death rates by age group and total deaths per year in Ontario.
You can also find COVID-19 Articles and Calculators and COVID-19 Weekly Stats for Ottawa, Canada and Historical Data of Ontario, Canada, and Global and Historical Data of Ottawa, ON and Measles Stats for Ontario, Canada.
Table of Contents
1. Variants
2. Wastewater (COVID, RSV, Flu)
3. Hospitalizations (COVID, RSV, Flu)
4. Hospitalization Rate by Age (COVID)
5. Case Rate by Age (COVID)
6. Virus Testing Results
7. Hospital Bed Occupancy by Age (COVID)
8. Death Rate by Age
9. Total Deaths by Month & Year
10. Historical Data of Ontario,
Canada, and Global (2020-2023)
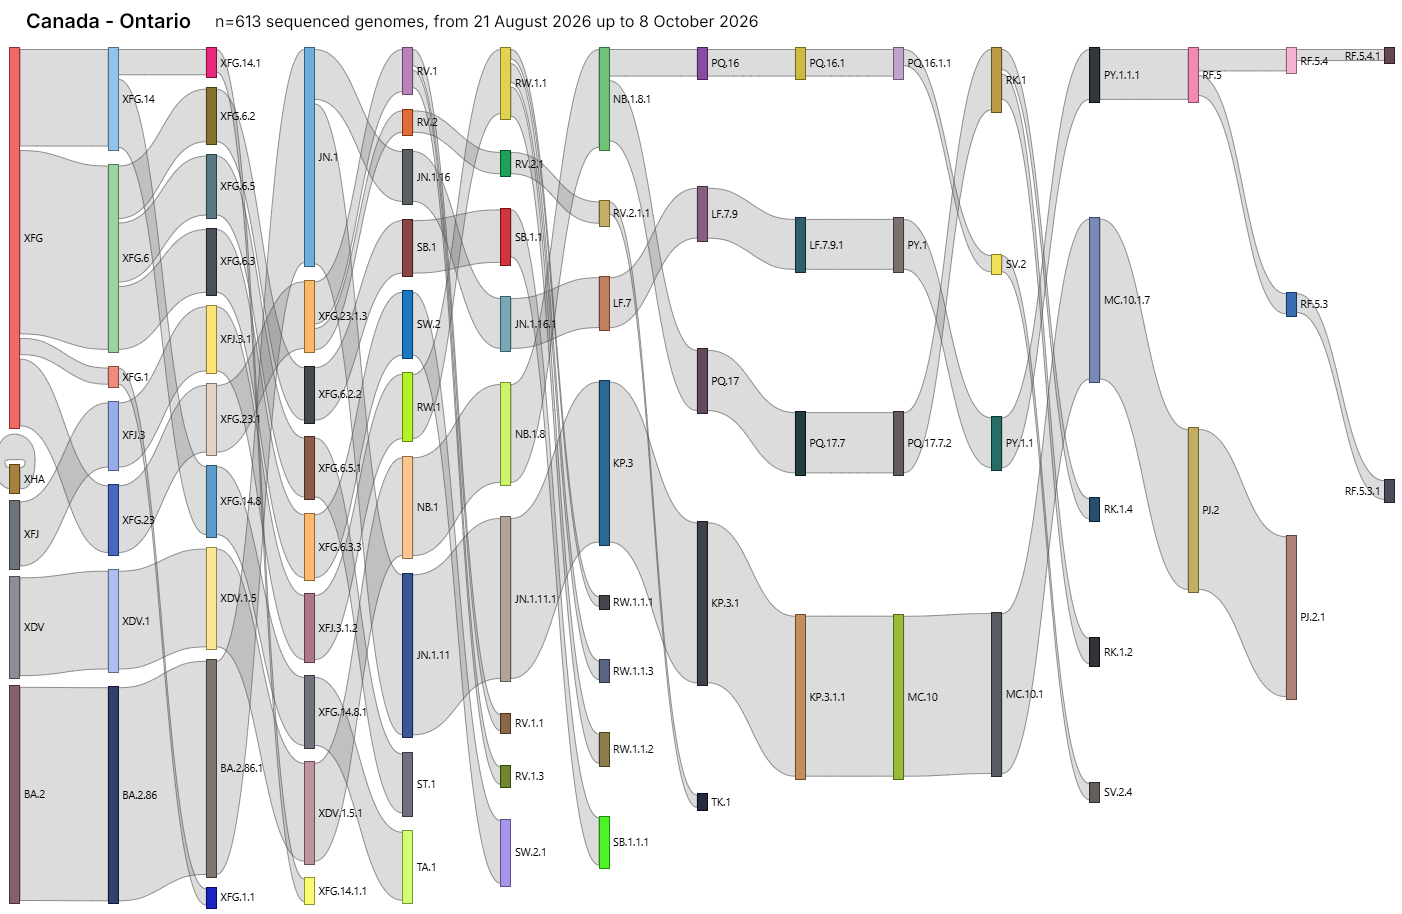
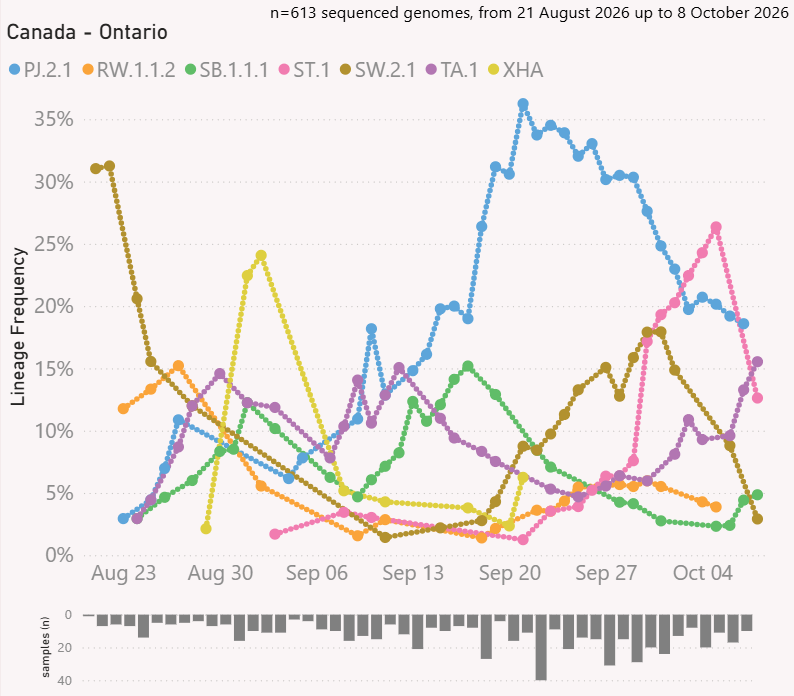
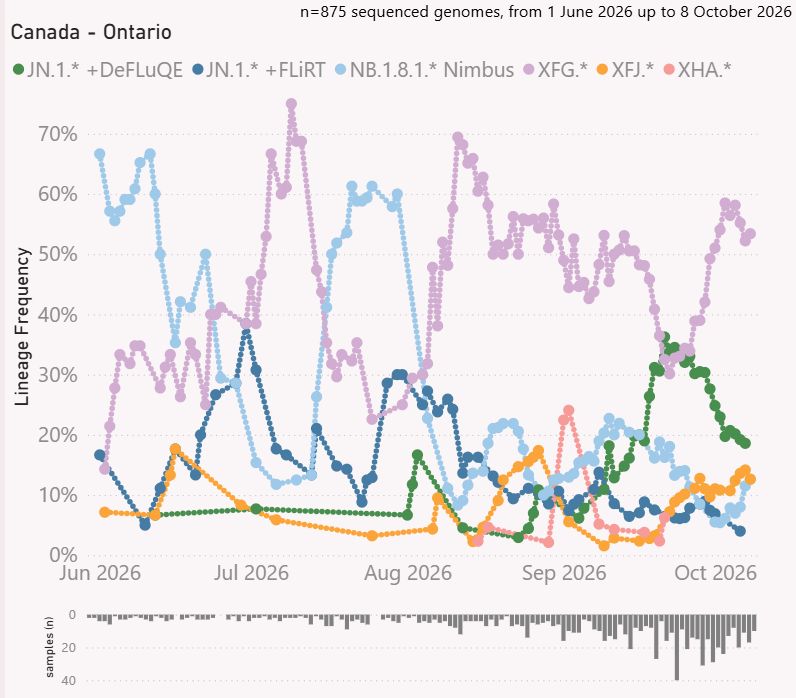
Variant genomic sequencing analysis uses data from gisaid.org with nextclade lineages and visualization by Mike Honey with source available on github. You can visualize variants in your own country or location by using this online visualization tool. Learn how to use the tool to see what variants are circulating in your area. Learn how to create a sankey diagram of variants in your area.
Sankey diagram showing overview of current variants in Ontario:
This line graph tracks the COVID 7-Day Rolling N2 Average of viral load in copies/mL across Ontario since Sept. 2025. This is combined data from the municipalities of Kingston, London, Peel Region and Toronto but does *not* include Ottawa. Data is pulled from National Wastewater Monitoring of Pathogens (NWMP) in the Respiratory Virus Activity section.
This second graph shows the same COVID wastewater levels but going back to November 2020. The vertical dotted lines show when specific COVID variants became dominant.
These line graphs tracks the RSV, Influenza A, and Influenza B 7-Day Rolling N2 Average of viral load in copies/mL across Ontario since 2023. This is combined data from the municipalities of Kingston, London, Peel Region and Toronto but does *not* include Ottawa. Data is pulled from National Wastewater Monitoring of Pathogens (NWMP) in the Respiratory Virus Activity section.
Hospitalizations (COVID, Flu, RSV)
Public Health Ontario now provides new hospitalizations in Ontario due to COVID-19, Influenza or RSV from their Respiratory Virus Tool in the Outcomes section.
Comparing previous years, new hospitalizations due to COVID have greatly decreased while Influenza is making a comeback.
This graph shows a different view making it easier to see the breakdown of hospitalizations between COVID-19, Influenza, and RSV as a percentage of patients between just those three viruses. You can see, COVID-19 causes hospitalizations more significantly throughout the whole year.
If you plot each of the new hospitalizations *due to* COVID-19, Influenza, and RSV virus as a line graph you can see throughout the year even when COVID-19 hospitalizations are at their lowest they usually remain above the levels of the other two and often significantly higher than both combined.
Hospitalization Rate by Age (COVID)
This graph shows the breakdown of hospital admissions for COVID per 100k population by age group. The age range definitions changed in September 2025 so we have limited data so far. Look further below for more historical data going back to Oct. 2021.
This second graph provides a different view stacking to 100% the # of patients per 100k population by age so you can see the proportion each week.
The following chart shows the COVID-19 hospital admission rate per 100k population by age group in Ontario from Sep 2025 to Present when they changed the age group definitions. While the rates of hospitalization from COVID have decreased since the start of the pandemic, the proportion of young children being hospitalized compared to older adults has increased a lot where the rates of age 0-4 are many times closer to the rates of older adults 65+ now.
This bar graph shows the breakdown of hospital admissions rate for COVID in Ontario between children (0-17) and adults (18+) since 2022.
Ontario used specific age groups from Oct 2021 to August 2025 which are shown in this graph of hospital admissions for COVID per 100k population As you can see while the 80+ age group had the highest rate of hospital admissions, the youngest children age 0-4 had third highest rate and more than adults aged 40-59.
Looking at Hospital admissions for COVID by age group for the entire period of October 2021 to August 2025 combined, you can see similar hospitalization rates for age 5-17 then increasing higher for 18-39, then 40-59. You next see a big jump in rate for age 0-4, followed by a really big jump with age 60-79 and then 80+ by far the highest rate.
When you break down the hospitalization rates by year, you can see they have gone down each year since 2022 across the board.
Originally Ontario broke down COVID hospitalization rate (per 100K population) by age with a <1 and 1-4 age group which properly showed than infants are at much higher risk from COVID. The following data shows the age rate with that age category since the 2019-20 viral season. Unfortunately Ontario stopped publishing this data after Jan. 20, 2024 but you can access the historical data from Public Health Ontario.
The following graph shows the % share of hospitalization rate so people can more easily see the impact of various age groups, specifically how the youngest and oldest populations are most impacted.
This graph shows a more traditional representation of the actual hospitalization rate per 100K population for each age group in the 2022-23 surveillance period. This really highlights how infants <1 had a higher hospitalization rate than older adults 60-79 and vastly higher rates than age 1-4 which shows just how much grouping <1 into a 0-4 age category hides what is happening with infants.
Is the situation still the same in 2024-2025? Alberta is still publishing hospitalization and ICU admission data for COVID broken down by age and include many more age groups so you can see infants <1 are still hugely impacted and 44x higher hospitalization rates than children 5-19. Infants have the highest ICU admission rate among all age groups by far.
The graphs below shows the COVID-19 cases per 100k population by age group in Ontario. For COVID-19, a positive PCR/NAAT result is counted as a case if separated in time by at least 90 days from a previous positive result. Testing is very limited so doesn't represent the general population like wastewater testing. Children would typically only get this kind of COVID test if they were at the hospital (e.g. ED visit, admission) so any reported child cases are likely more serious. Data from PHO.
The next set of charts illustrate the annual proportion of COVID-19 cases per 100,000 population in Ontario across different age groups. The graph visualizes how the relative distribution of cases shifts over time among demographics ranging from infants to seniors aged 80 and older.
Ontario Virus Testing Results
(PCR)
This graph looks more broadly at circulating viruses in Ontario being tested displaying the test percent positivity each week for the current surveillance year. Data from PHO.
This graph provides a different view stacking to 100% the test positivity of circulating viruses for the current surveillance year so you can see the proportion each week. Data from PHO.
This following graph shows a range of circulating viruses being tested displaying the test percent positivity each week with a longer historical window since August 2022. Data from PHO.
This graph provides a different view stacking to 100% the test positivity of circulating viruses so you can see the proportion each week. Data from PHO.
Hospital Bed Occupancy Rate by Age (COVID)
These graphs below show the Ontario COVID hospital bed occupancy rate (per 100K population) grouped by age which presents the average daily occupancy count per week of people in hospital (including the ICU). You can access the latest data from Public Health Ontario.
These graphs below show the Ontario COVID death rate (per 100K population) grouped by age since the 2019-20 viral season. You can access the latest data from Public Health Ontario.
The first graph shows the % share of death rate so people can more easily see the impact of various age groups, especially our oldest population.
The second graph shows a more traditional representation of the actual death rate per 100K population for each age group during each viral season.
The graphs below show the total Ontario deaths involving COVID-19 obtained from official Ontario data. Older archived data of COVID-19 deaths up to Nov. 14, 2024 by fatality type is also available.
Note:this is still likely an under-count of deaths as COVID has been shown to increase risk for cardiovascular issues,blood clots, strokes, and risk of mortality months or even 1+ years after infection which could contribute to a death but may not be linked to the person's COVID infection many months in the past. See Canada Report on Long COVID.
The first graph shows total Ontario deaths per year or the current # of deaths year to date (YTD) for the current year. Note, for 2020 death totals are only available from March 2020. There are delays in reporting deaths so previous totals may also be updated.
The second graph shows total Ontario deaths per month. Note, there are delays in reporting deaths so previous totals may be updated and more recent months will not be accurate.
|
 |