|
Measles Virus Weekly Stats for Ontario, Canada |
This page contains data from official Ontario, Canada measles data sources including Public Health Ontario, updated weekly to show this year's measles rate by age, case vaccination status by age, weekly cases this year, and historical yearly cases.
You can also find COVID-19 Articles and Calculators and COVID-19 Weekly Stats for Ottawa, Canada and COVID-19 Weekly Stats for Ontario, Canada.
Table of Contents
1. Information
2. Rate by Age, Hospitalization, & Case
3. Weekly # Cases
4. Yearly # Cases
5. Geographic Location of Measles Cases
6. Vaccination Status by Age
The measles virus is one of the most contagious viruses known to humans, it is airborne and aerosols from an infected person can remain in the air for hours after the infected have left the room and then infect up to 95% of susceptible people who unsuspectingly breathe them in. People become infectious from measles 4-5 days before rash onset and 4-5 days after symptoms have gone meaning you can get infected by someone who seems perfectly healthy. The measles virus also has another nasty feature, for 2-3 years after infection it damages antibody memory that your immune system has already created from previous infections so no longer remembers how to quickly fight off those infections it has seen before and needs to start from scratch again. Since measles infection impacts your immune system and causes transient immunosuppression for potentially years after infection, people are also more susceptible to injury and death from other infections taking advantage of the measles-induced immune damage. It is not just about surviving your initial measles infection, but also the years afterwards until your immune system is no longer compromised. Sadly even now (in 2023), there are an estimated 295 children dying of measles every day globally! In order to stop measles outbreaks, more than 95% of a population needs to be protected from measles infection.
Some interesting articles and podcast that explain in more detail:
Rate by Age, Hospitalization,
& Case
The graph shows the rate of measles cases per 100k population broken down by age for this surveillance year to date. You can see from the graph that our children are most vulnerable. Data source: PHO Measles Enhanced Epidemiological Summary
This second graph shows the rate of measles hospitalizations and cases per 100k population broken down by overall population, unvaccinated/antibody negative population, and vaccinated/antibody positive population for this surveillance year to date. This is estimated using Ontario population immunity from the CIRN study. Data sources: PHO Measles Enhanced Epidemiological Summary, Ontario data from: Population immunity to measles in Canada using Canadian Health Measures survey data – A Canadian Immunization Research Network (CIRN) study and Ontario Census data.
The graph shows the number of measles cases weekly in this surveillance year to date by week of rash onset and case classification. Data source: PHO Measles Enhanced Epidemiological Summary
The graph shows the number of measles cases yearly from 2013 to the current year to date. Data source: PHO Measles Enhanced Epidemiological Summary
Geographic Location of Measles Cases
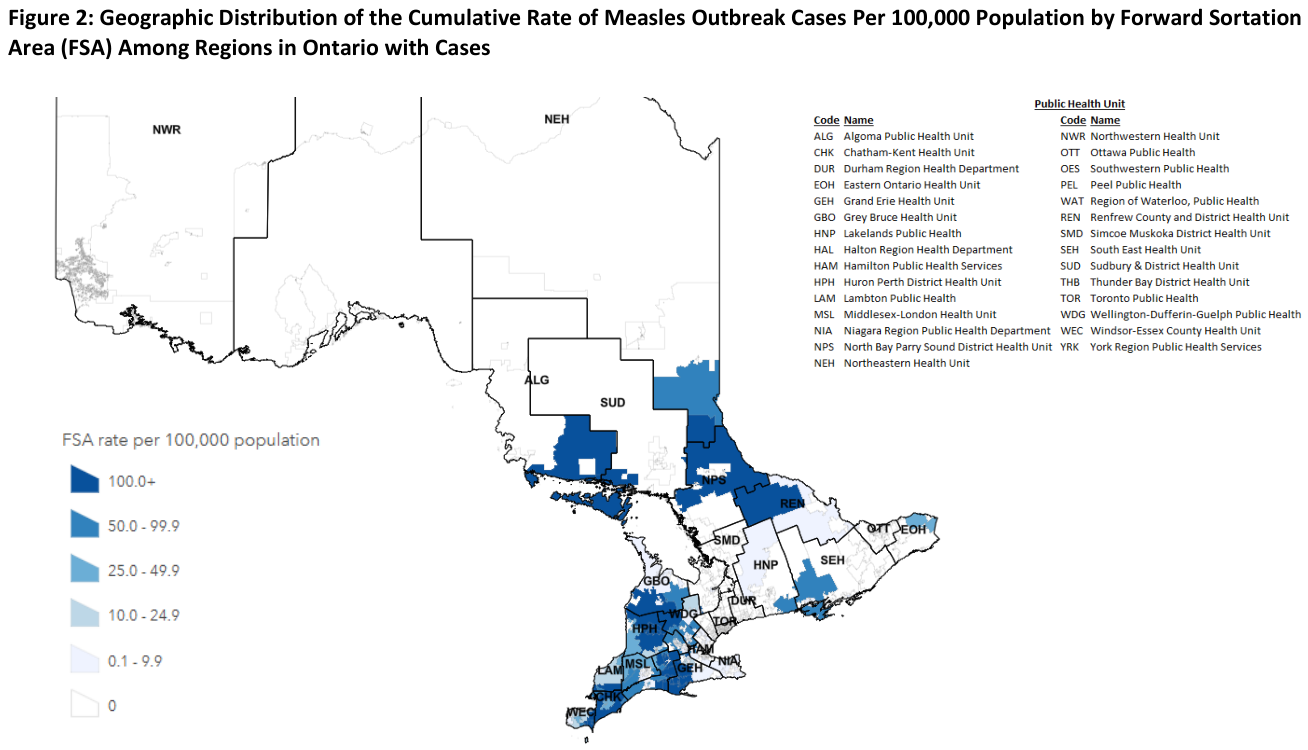
The map shows the Geographic Distribution of the 2024/2025 Rate of Measles Outbreak Cases Per 100,000 Population by Forward Sortation Area (FSA) Among Regions in Ontario with Cases. FSA boundaries do not align with public health unit boundaries, and some FSAs span multiple public health units. Further, the rates in this map are by residential FSA, which may not correspond to the location of the case at the time of illness onset or report to public health. Data source: PHO Measles Enhanced Epidemiological Summary
The graph shows the measles vaccination status of cases by age group with more than 94% of cases in our children being unvaccinated. Data source: PHO Measles Enhanced Epidemiological Summary
The graph shows the measles vaccination coverage for children age 7 in the 2023-2024 school year for Ontario, Ottawa, and Toronto. Public Health Ontario only publishes the 0, 1, 2 vaccine dose data for age 7. Data source: PHO Infectious Disease Immunization Data Tool
The graph shows the 2 dose measles vaccination coverage for school age children in the 2023-2024 school year for Ontario, Ottawa, and Toronto. Note that 1 dose of measles vaccine has about 93% efficacy and 2 doses has 97% efficacy. Data source: PHO Infectious Disease Immunization Data Tool
The graph shows the breakdown between children with less than 2 doses of measles vaccine and those with 2+ doses of measles vaccine in the 2023-2024 school year for Ontario, Ottawa, and Toronto. Note that < 2 measles doses is a mixtures of those who had 0 doses or 1 dose of vaccine, but unfortunately PHO does not provide the details. Data source: PHO Infectious Disease Immunization Data Tool
|
 |